 :Where Robotic Manipulation Meets Structured and Scalable Evaluation
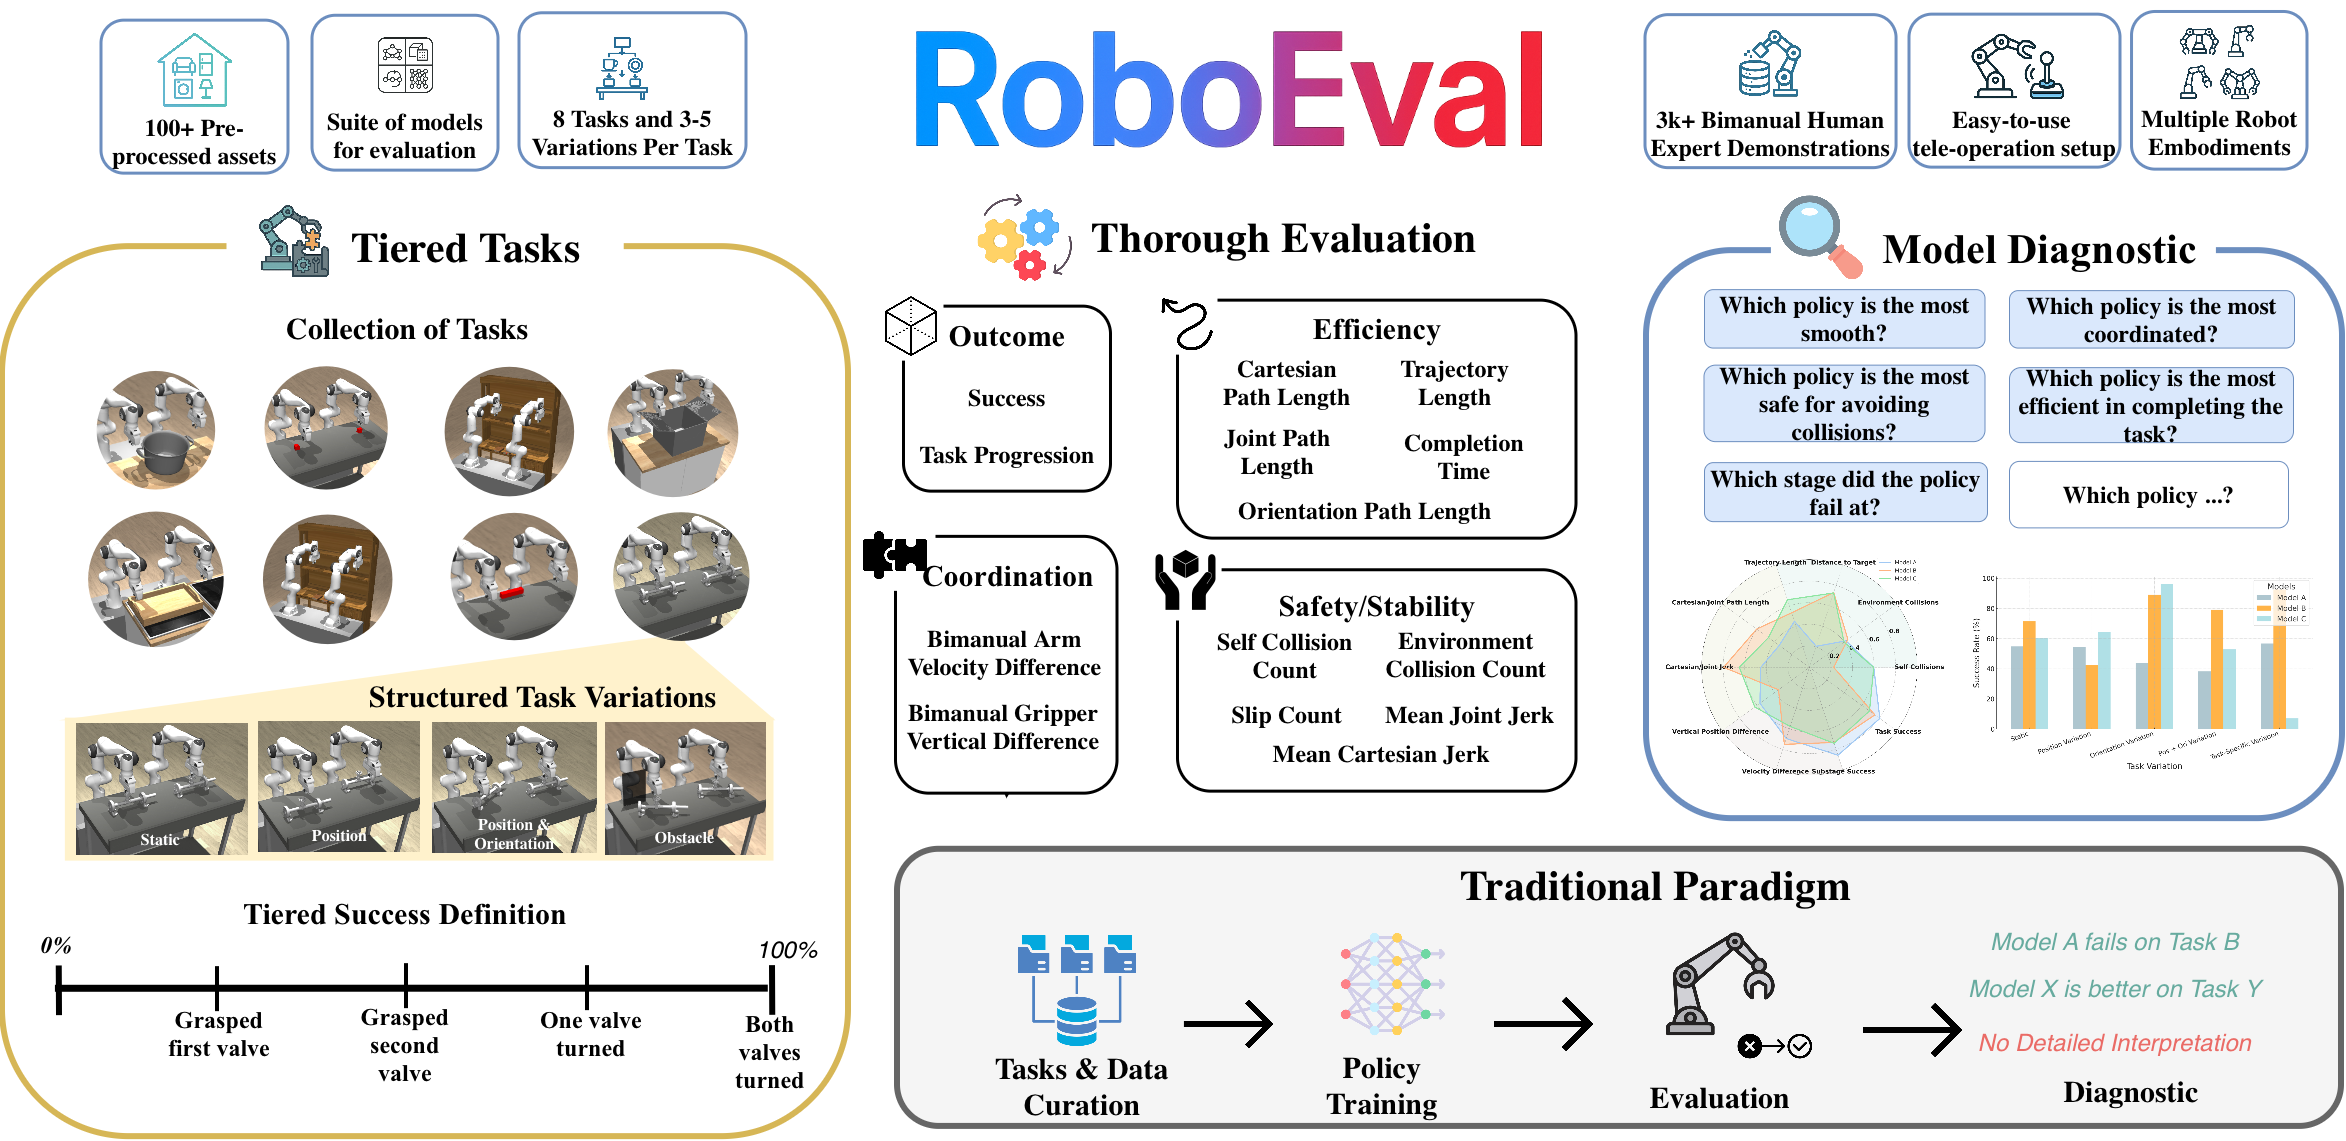
We present RoboEval, a simulation benchmark and structured evaluation framework designed to reveal the limitations of current bimanual manipulation policies. While prior benchmarks report only binary task success, we show that such metrics often conceal critical weaknesses in policy behavior—such as poor coordination, slipping during grasping, or asymmetric arm usage. ROBOEVAL introduces a suite of tiered, semantically grounded tasks decomposed into skill-specific stages, with variations that systematically challenge spatial, physical, and coordination capabilities. Tasks are paired with fine-grained diagnostic metrics and 3 000+ human demonstrations to support imitation learning. Our experiments reveal that policies with similar success rates diverge in how tasks are executed—some struggle with alignment, others with temporally consistent bimanual control. We find that behavioral metrics correlate with success in over half of task-metric pairs and remain informative even when binary success saturates. By pinpointing when and how policies fail, ROBOEVAL enables a deeper, more actionable understanding of robotic manipulation—and highlights the need for evaluation tools that go beyond success alone.
RoboEval is a benchmark for evaluating bimanual manipulation policies under diverse task settings. The first iteration consists of 10 base tasks and 3000+ human demonstrations. The tasks are derived from common tasks that humans perform in diverse settings, from service style tasks such as lifting a tray, to warehouse tasks like closing a box, to industrial tasks like rotating hand-wheels. Each task includes multiple variations—ranging from static setups to dynamic shifts in object pose and semantic context—designed to assess policy performance in a systematic manner. To facilitate research in imitation learning and demo-driven policy training, we provide a suite of raw expert human demonstrations, along with fine-grained evaluation metrics such as trajectory smoothness, environment collisions, etc.
| Task Name | Variations | # Demos | Traj Len | Skills | Coordination Type |
|---|---|---|---|---|---|
| Lift Tray | Static, Pos, Rot, PR | 543 | 67.584 | grasp, lift | Tight Sym. |
| Stack Two Cubes | Static, Pos, Rot, PR | 492 | 107.047 | grasp, hold, place | Loosely Coord. |
| Stack Single Book Shelf | Static, Pos, PR | 202 | 172.302 | push, grasp, lift, place | Loosely Coord. |
| Rod Handover | Static, Pos, Rot, PR | 408 | 93.529 | grasp, hold | Loosely Coord. |
| Lift Pot | Static, Pos, Rot, PR | 176 | 53.170 | grasp, lift | Tight Sym. |
| Pack Box | Static, Pos, Rot, PR | 394 | 133.216 | push | Uncoord. |
| Pick Book From Table | Static, Pos, Rot, PR | 366 | 105.984 | grasp, lift | Loosely Coord. |
| Rotate Valve | Static, Pos, PR | 349 | 119.610 | grasp, rotate along axis | Uncoord. |
We evaluate policy performance across outcome, efficiency, bimanual coordination, and safety/stability.
Outcome
Efficiency
Coordination
Safety/Stability
Select a task, variation, and method to view a collage of episode rollouts. Each tile is an independent evaluation episode: a green border marks a successful episode and a red border marks a failure.
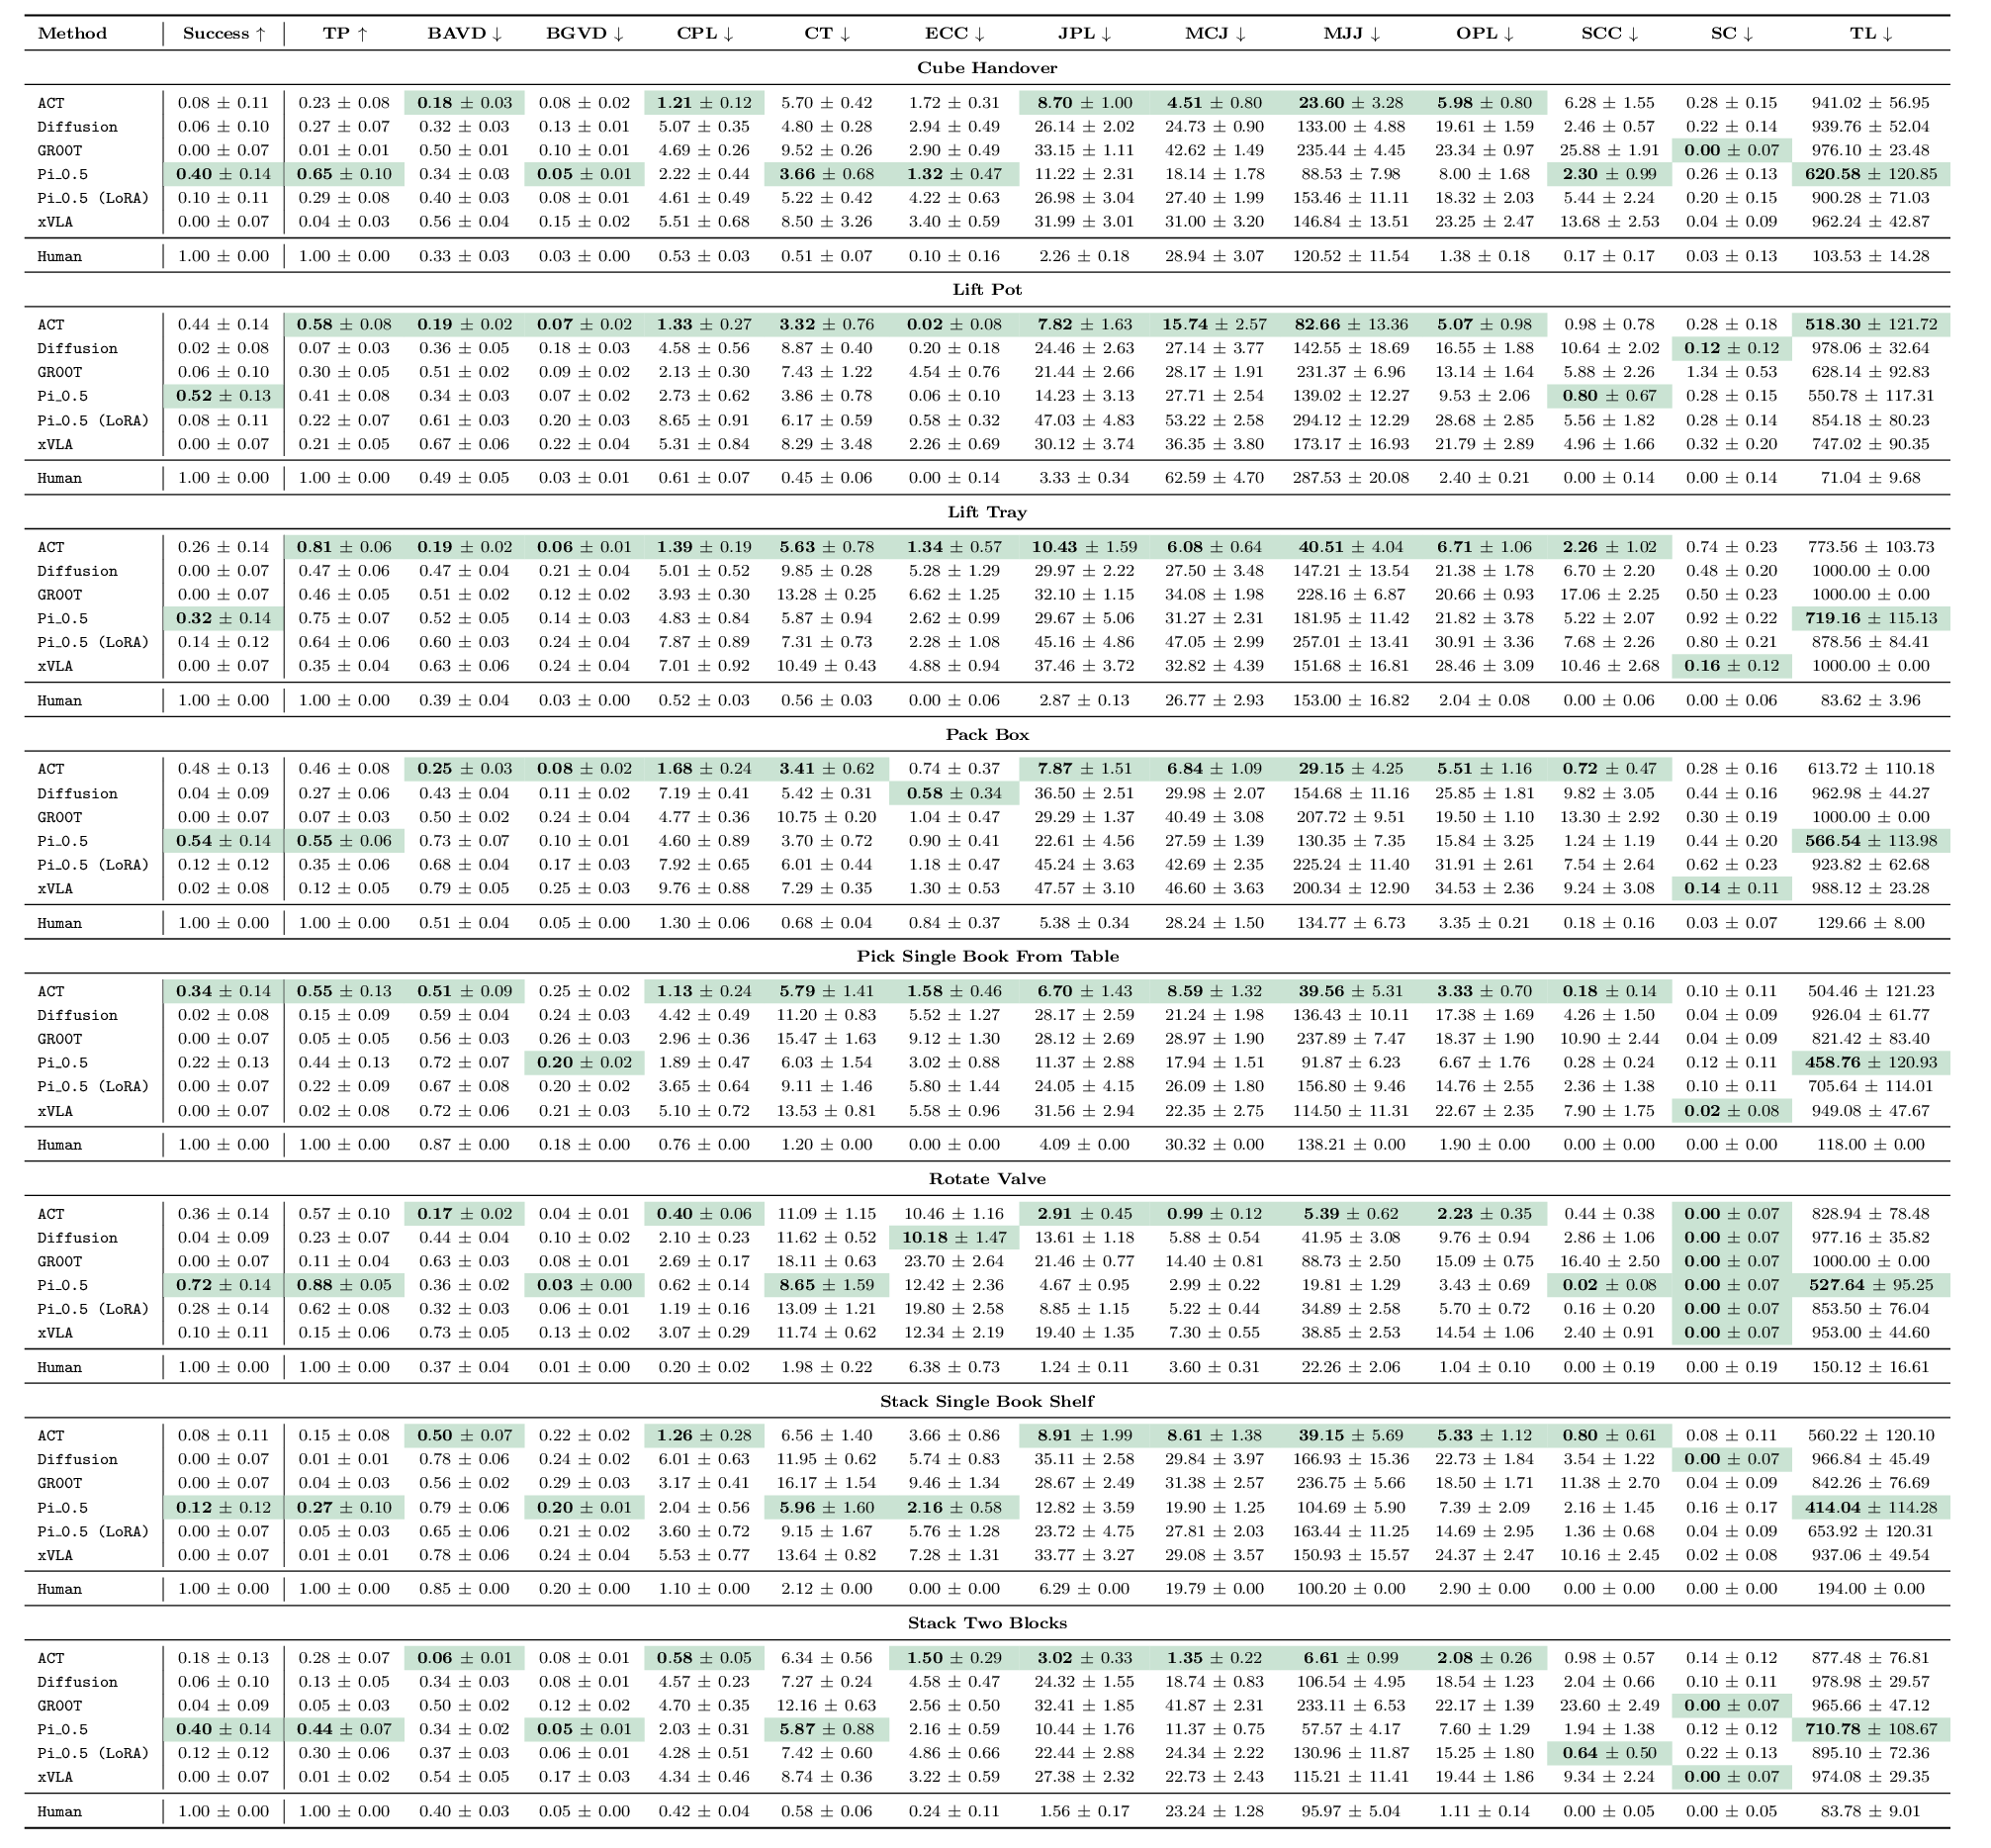
Sort models by any metric. Default sorting follows the best direction for each metric (higher for upward-arrow metrics, lower for downward-arrow metrics).
This section provides a per-task summary with failure mode heatmaps first, then metric performance graphs below, so you can review failure patterns and compare methods.